Unpacking Malware
In manual and automated ways
Unpacking Malware
In manual and automated ways
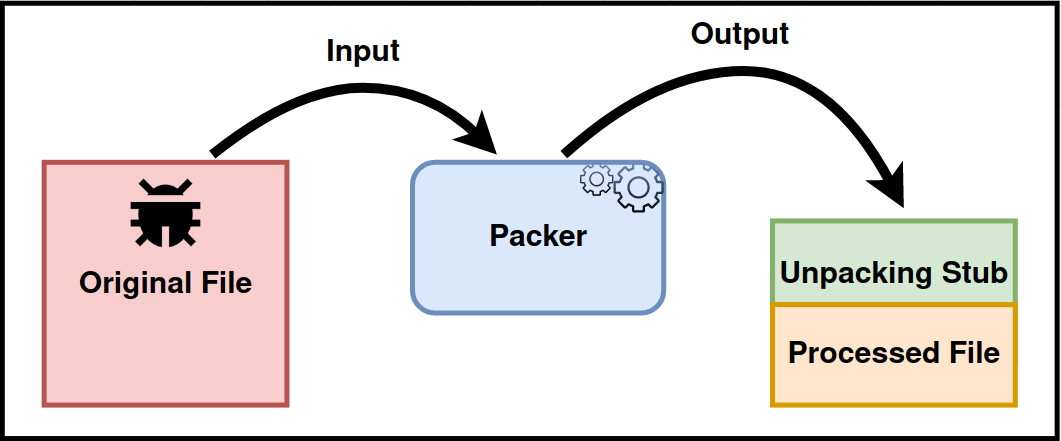
Initially, Packers were just software born to protect developers’ intellectual property by hiding the inner mechanisms of software. Nowadays, cybercriminals use them too to make malicious executables avoiding static detection by hiding the operations they will perform. Many free packers are used to obfuscate malware, such as UPX, PE Protector, and MPRESS, to name a few, but malware developers also take care of this aspect by building custom routines to pack and unpack their precious creation. These routines usually go by the name of Crypters, and unlike commercial packers, they are not “general-purpose”, in that their unique objective is to pack and unpack the payload they have been created for. There exists a similarity between encryption and packing; both enhance the entropy of the target data, avoid bit-sequence repetition, and obtain a result that looks like random junk. The difference is that packing usually expects data compression, so a reduction of the size of the executable.
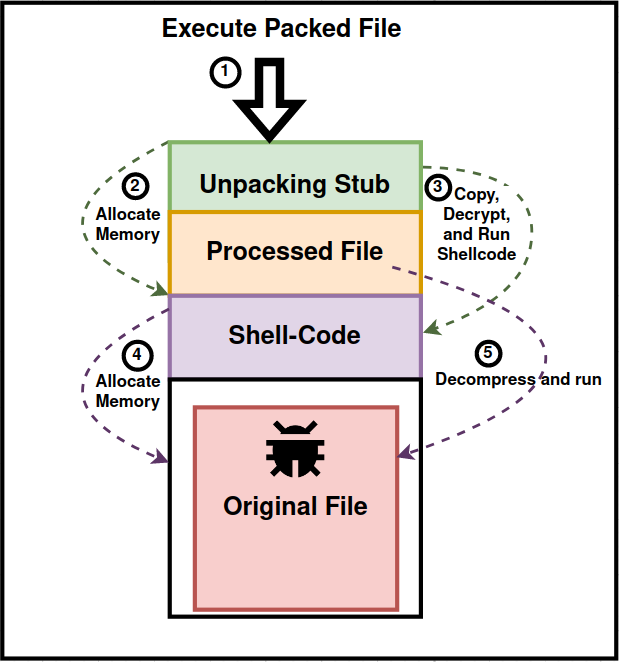
After being packed, a target executable is divided into at least two parts: an unpacking stub , also called an “envelope”, and the actual compressed data.
When started, a packed file would execute the unpacking stub that performs operations such as allocating new space, decrypting and copying further instructions, running those instructions, and so on, until the data composes the original file and can finally be executed.
Malware analysts developed several techniques to cope with packing, ranging from fully manual, semi-automated, and fully automated.
1: Locating Tail (or Section) Jumps
Packers like UPX and MPRESS have in common that after the decompression routine, there is usually an inter-section jump, so an instruction that moves the Instruction Pointer from one section to another, this could be accomplished by a jump or equivalent instruction, (like push aex, return) .
2: Intercepting “Signature-Functions”
The packed executable often injects code in its or others’ process address space using a variety of Windows API calls. Tracing manually or putting break-points on these function calls is usually sufficient to locate the unpacked payloads. This method can also identify which covert execution technique the malware could attempt to use. Of particular interest are all the API calls that can be used for Getting the handle on the target process and for Allocating , Copying , Altering Permissions , and Triggering the execution of memory regions.
3: Using Automated Tools
Malware analysts used their wits to build services able to automatically dissect and unpack malware. Examples of these are from the work of @hasherezade pe-sieve / hollow-hunter and mal_unpack , or unpac.me , The founding Idea used by these kind tools is diverse, for example in the case of pe-sieve and derivates the main idea is
to detect code overwritten in memory by comparing it with the executable on disk
while pandare , uses whole system analysis to spot changes in entropy in processes and dump the corresponding memory sections.
The Sample
In this blog post we are going to unpack a sample of the RedLineStealer malware you can find at this link . The use of a VM is highly recomanded, since in the Automated Tools chapter we need to start an infection, possibly collecting second stage payloads from the internet.
MD5 :
618ea7b0e2a26f3c6db0a8664c63fc6f
SHA256 : 3215decffc40b3257ebeb9b6e5c81c45e298a020f33ef90c9418c153c6071b36
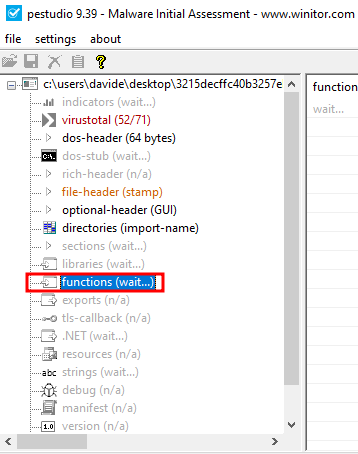
Pestudio is not able to recover any function imported by the sample, a sign that it is in fact packed.
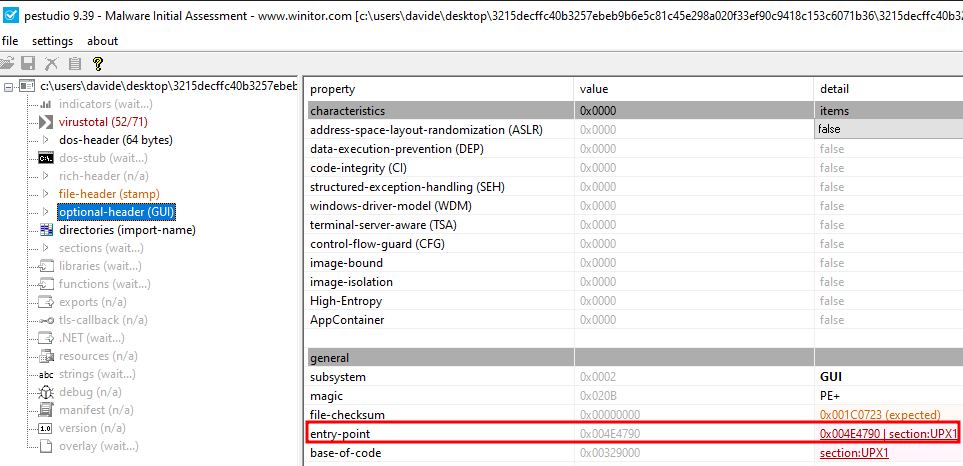
Looking in the file-header we can notice the usual name used by UPX for its sections.
Locating Tail (or Section) Jumps
We can expect the Unpacking Stub to jump into another section for executing the unpacked code, so we are searching for a jump instruction that could also be indirect but, in our case with UPX, will be direct. In this case, we can let our eyes help us by looking at the code-graph arrows between code blocks.
In particular, we are searching for jumps from the entry point section to any other section, and we can check which section the program starts by looking at the Functions window. Instead, in in the Segments window (View→Open Subviews → Segments), we can learn what the address ranges for the sections are, which is a piece of very precious information for our search.
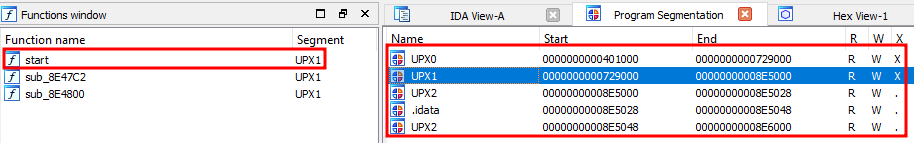
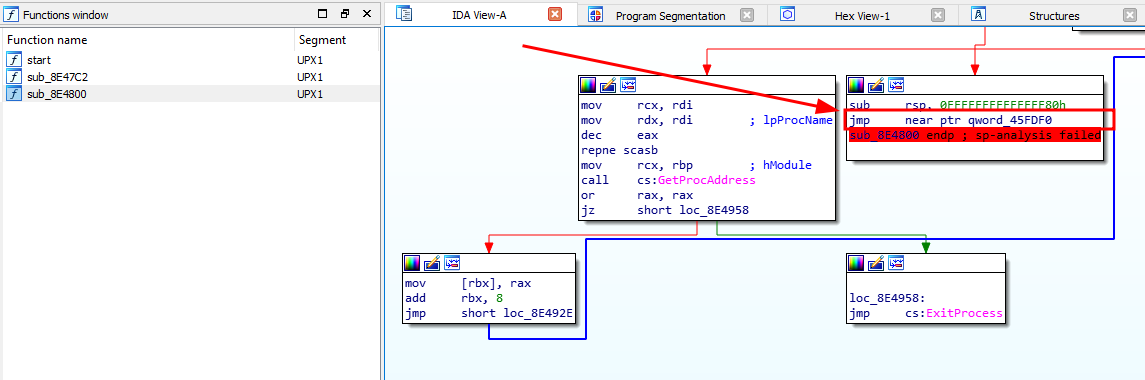
We can see that section UPX1, where we are now, is not that huge (from 729000 to 8E5000), so we might expect the TAIL JUMP into another section. By the end of the graph representation of sub_8E4800 method, we can notice the direct jump to an address in the UPX0 section.
From a rapid look to the target address we see very clearly that we are at the end of the UPX0 section, and the disassembler was not able to decode any instruction in it.
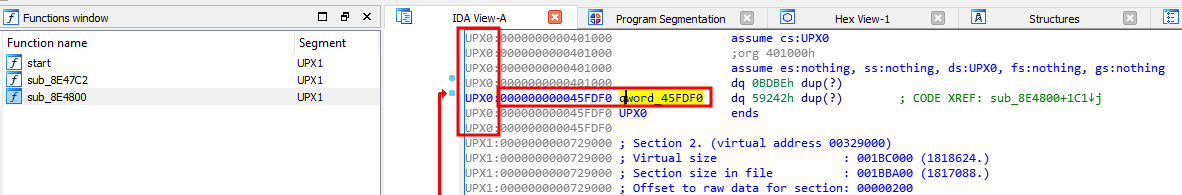
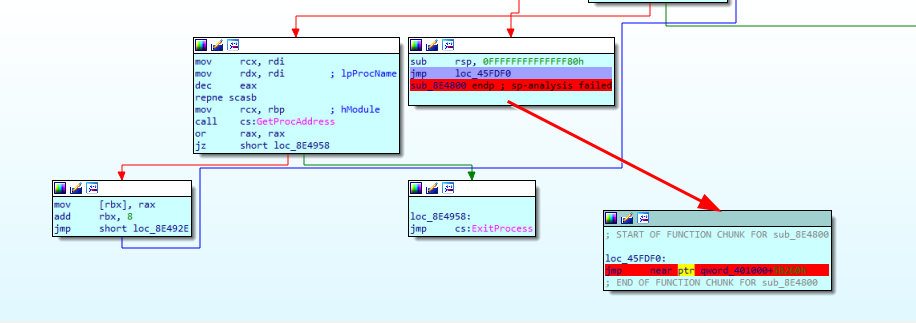
From a quick look at the target address, we clearly see that we are at the end of the UPX0 section, and the disassembler could not decode any instructions. We can put a breakpoint on that jump and let the debugger run to validate this hypothesis. After the breakpoint is hit, we make IDA re-analyze the program with the menu option: Options — General — Analysis — Reanalyze Program — Ok.
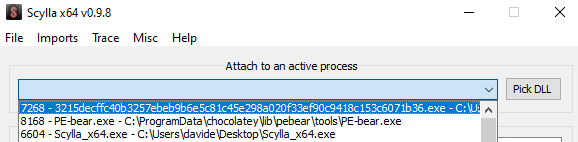
Now it’s time to use Scylla to dump the memory and reconstruct the IAT. Open Scylla and select the process IDA is debugging
Then set the Original Entry Point (OEP) to the target address of the tail jump (45FDF0), or even of the tail jump instruction itself, then press IAT Autosearch and Get Imports,
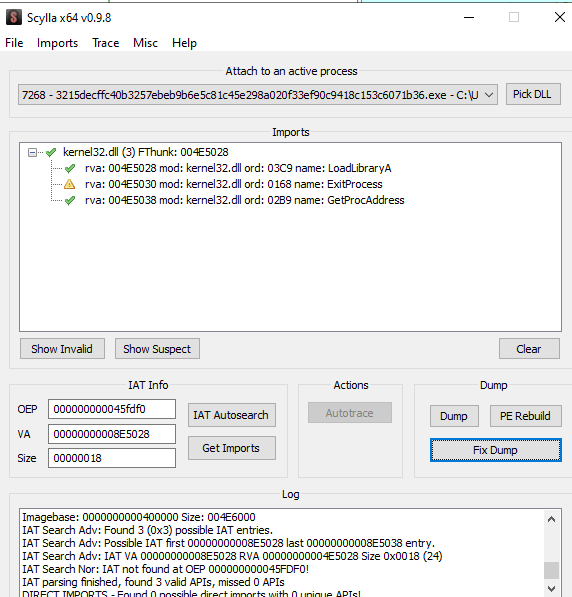
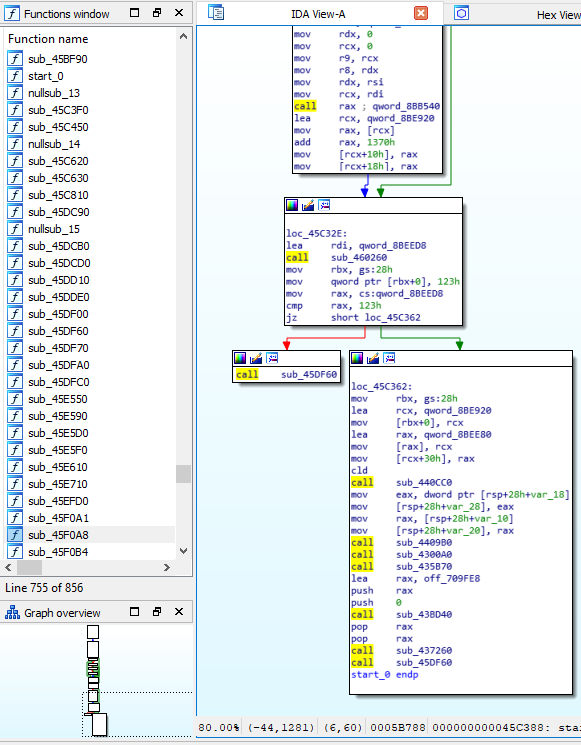
Finally, we can press Dump to save the new PE and Fix Dump to adjust the raw size. Finally, by opening the dumped file, we can recognize the main routines of RedLineStealer.
Intercepting “Signature-Functions”
This method could be thought of as a general method for debugging malware searching for payloads, which could be either PEs, DLLs, or Shellcodes.
Depending on the Process Injection Technique we are looking for, we would put breakpoints on different sets of API calls. Examples could be setting breakpoints on OpenProcess , VirtualAllocEx , WriteProcessMemory, and CreateRemoteThread for process injection , or on CreateProcess , ZwCreateSection , ZwQueryInformationProcess , ReadProcessMemory , ZwMapViewOfSection , GetCurrentProcess , WriteprocessMemory, and ResumeThread for Process Hollowing.
In our case, we could limit the search to LocalAlloc, VirtualAlloc , VirtualProtect , and CreateProcessInternalW, hoping that UPX will resolve and use these dynamically. For doing it, we use x64dbg for opening the sample, run until the EntryPoint and add the breakpoints using the console.
bp LocalAlloc
bp VirtualAlloc
bp VirtualProtect
bp CreateProcessInternalW
In this case, with UPX this method is not that fruitful, so we will see it better in a later post.
Using Automated Tools:
To demonstrate the power of automated tools, we will use pe-sieve . You can install it using chocolately:
choco install pesieve
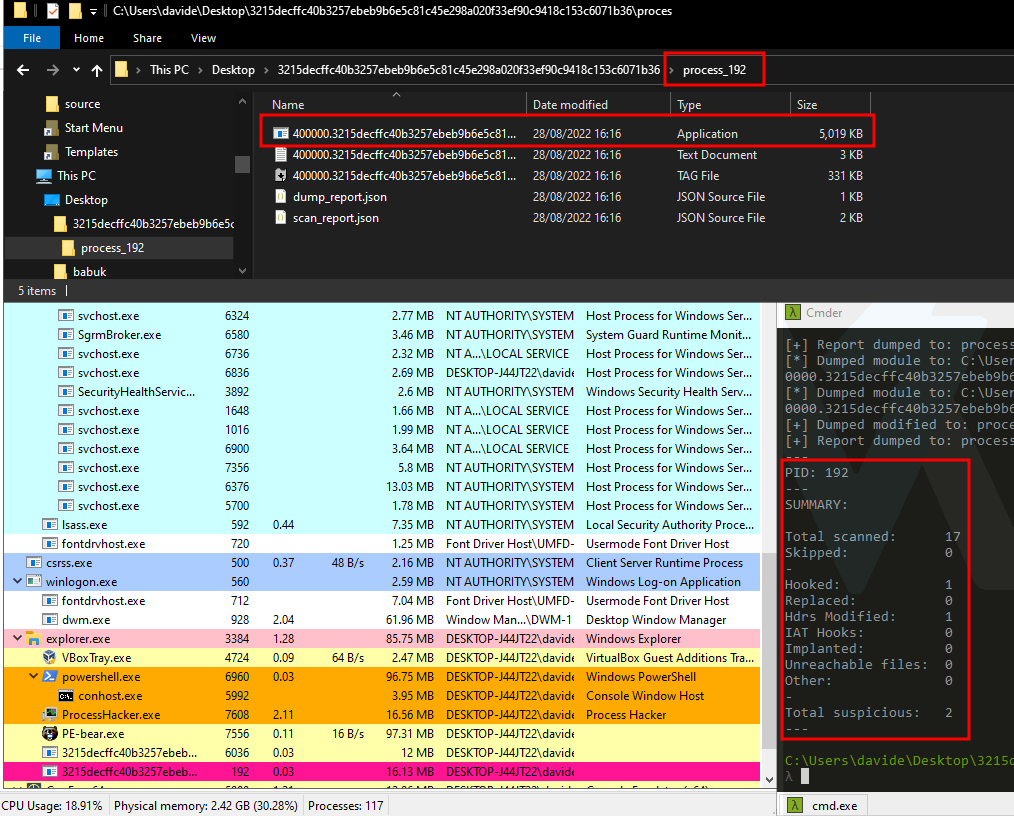
After downloading the sample, we can run it so that we can take note of the PID.
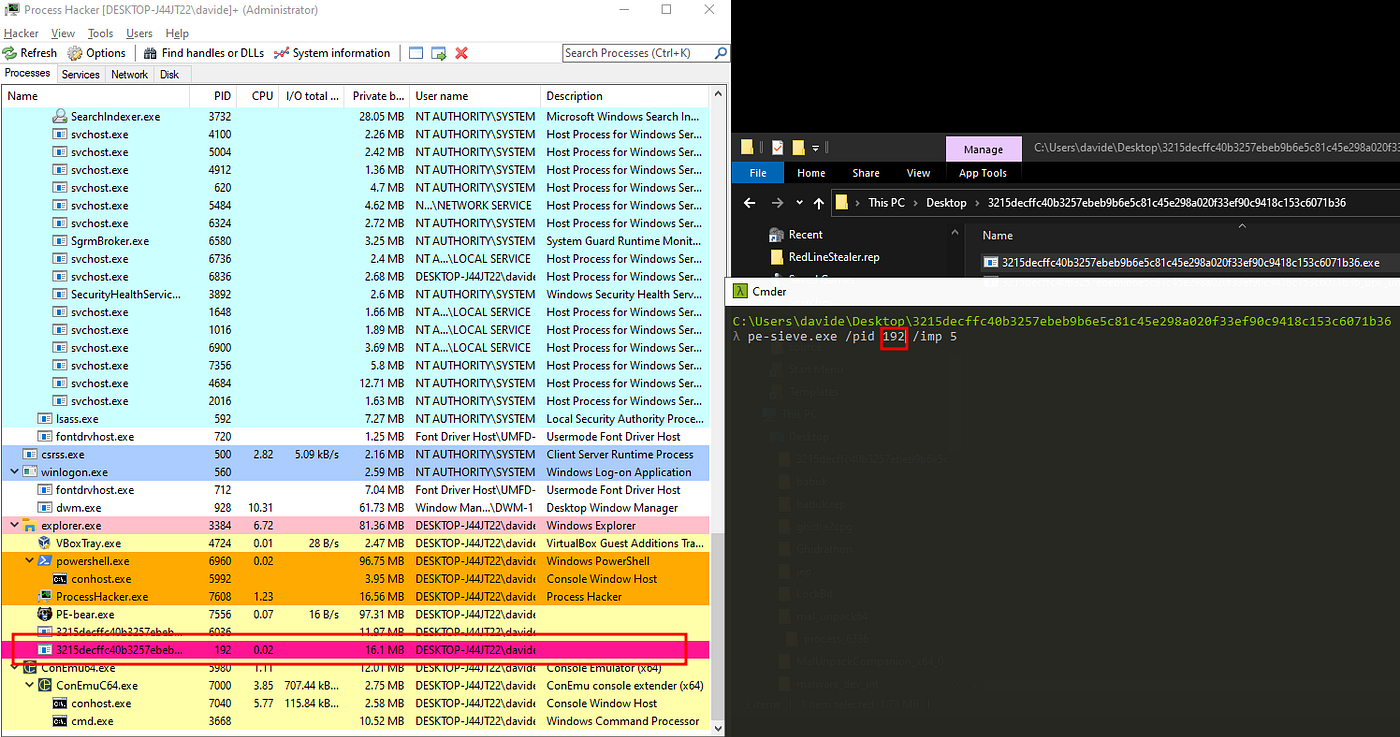
Next, we run pe-sieve, specifying the /pid and /imp arguments used to target the desired process and attempt to reconstruct the IAT.
pe-sieve.exe /pid 192 /imp 5
Pe-sieve is going to create a folder with the memory dumps it spotted during the analysis and a JSON file with the result:
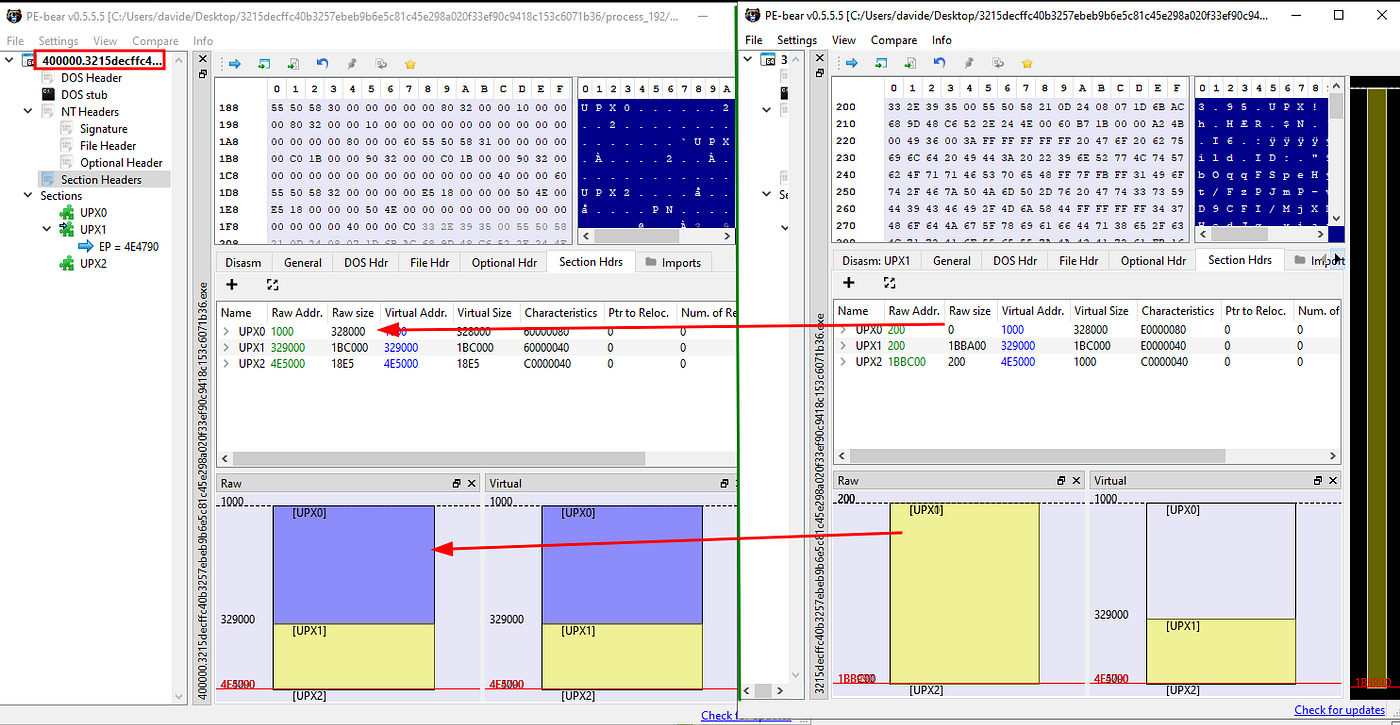
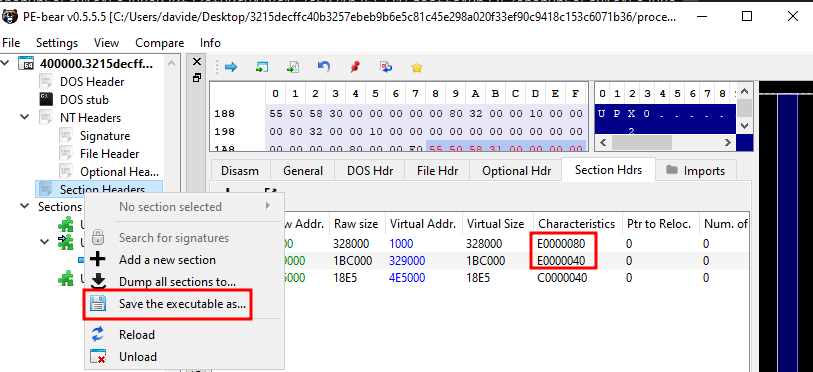
Comparing the sample with the Dump, we can observe how the raw size of section UPX0 is changed from 0 to 32800 bytes.
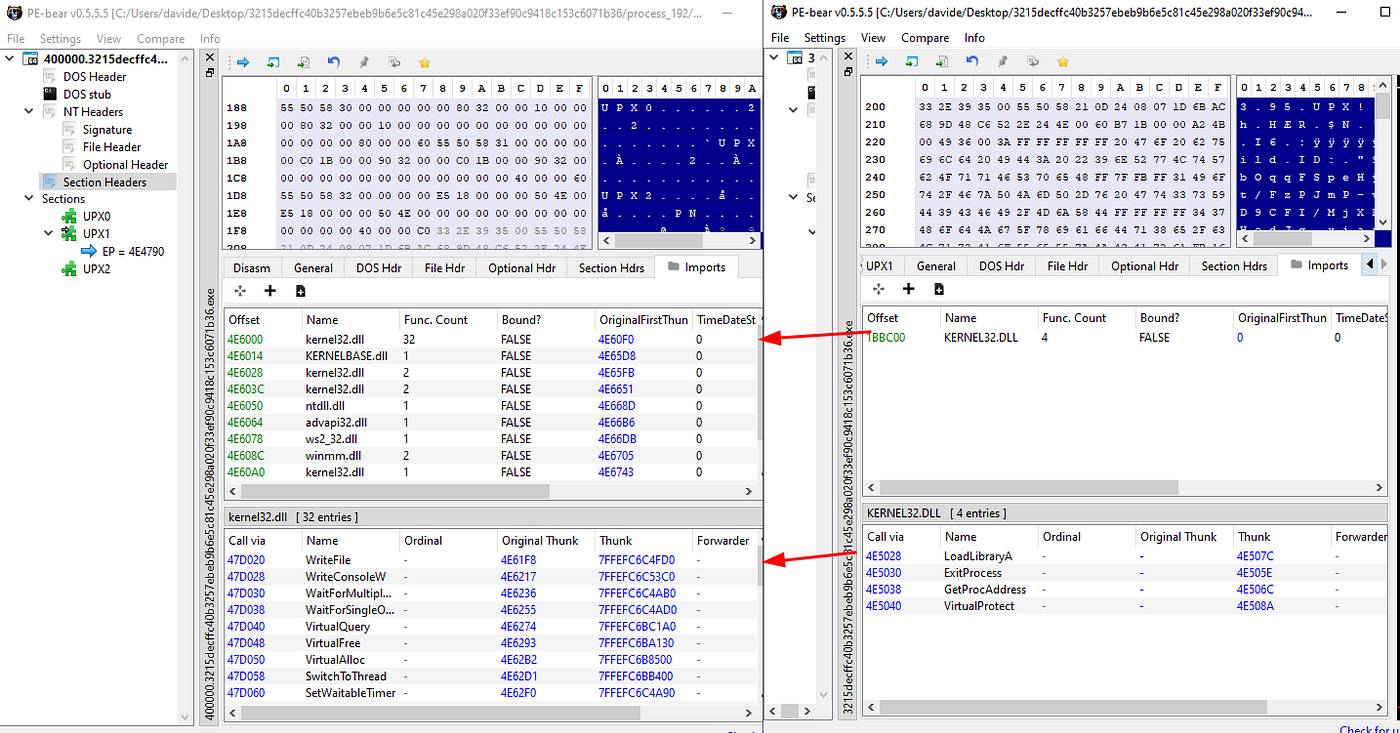
Looking at the imports, we can observe that the IAT reconstruction process was so successful that we now also have visibility of the functions the malware resolves dynamically.
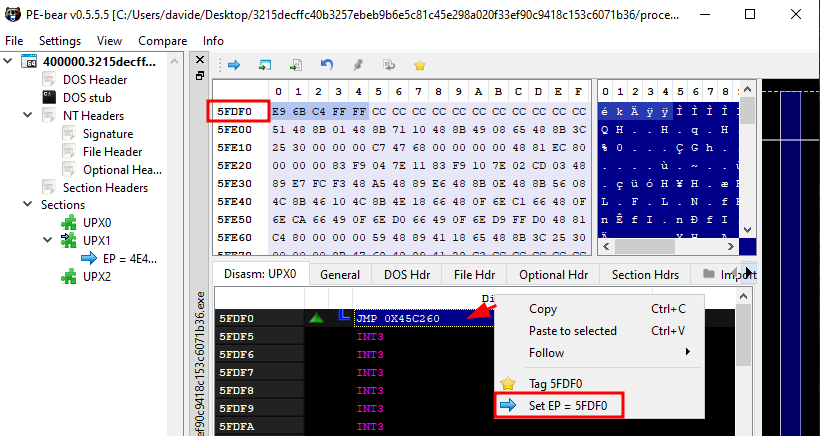
To debug the sample, we need to fix the dumped sample’s entry point and set the sections as executable. For the first actions, we can use tiny_tracer , which will help us to track the section jumps. Right-clicking on the sample and selecting “Run with PIN (Tiny Tracer)” , will start to collect some execution artifacts, saving them into a “.tag” file that we can open with BareTail .
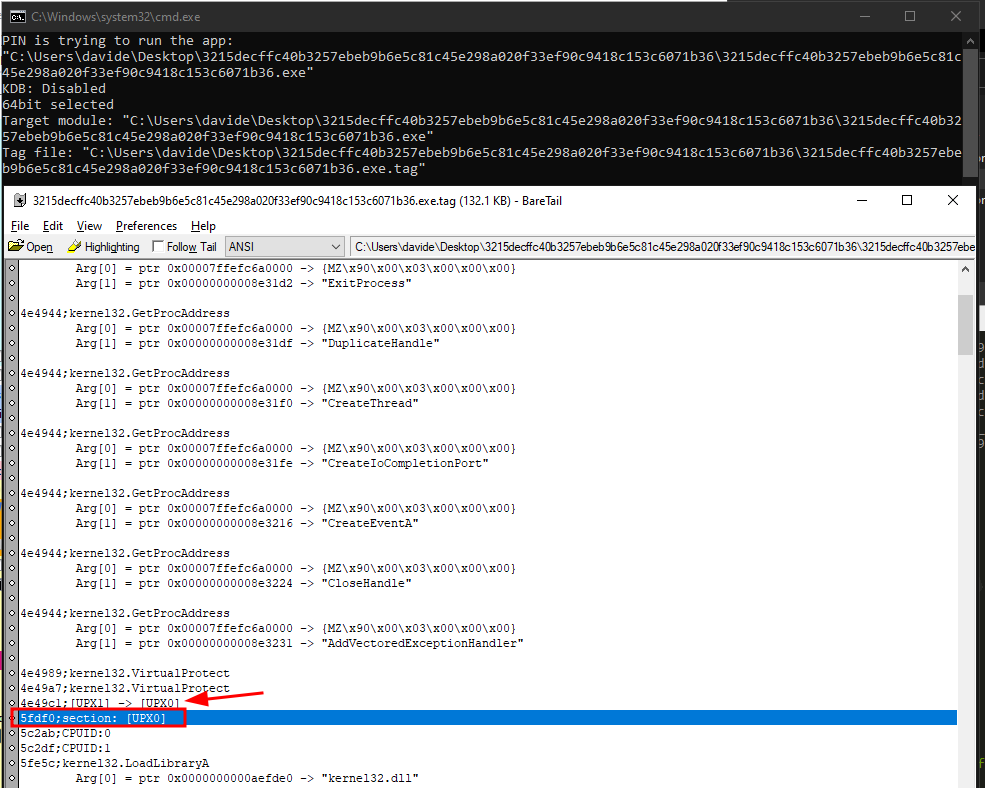
So we can adjust the entry point.
Set both UPX0 and UPX1 as executable, and save the adjusted Dump.
Finally, we have a working unpacked executable that can be debugged.
Conclusions
In this post, we went through several ways of unpacking a RedLineStealer sample compressed with UPX, ranging from complete static code analysis with IDA to almost fully automated with PE-sieve. For more sophisticated packers, different procedures might be needed. Hopefully, leveraging the power of many RE Engines like Ghidra, IDA, and BinaryNinja, that offer API access to their database to automate operation, even beginner analysts can tackle the unpacking of even more complex obfuscators.
Further Readings:
Snowy Days & The Malware Packing Ways | Magic Bytes
References:
https://marcoramilli.com/2020/10/09/how-to-unpack-malware-personal-notes/
https://speakerdeck.com/hshrzd/pe-sieve-detecting-hooking-and-code-implants?slide=30
1055681 — MALWARE ANALYSIS AND INCIDENT FORENSICS | Catalogo dei Corsi di studio
Post converted from Medium by ZMediumToMarkdown.